Quantitative trading
Exposed probabilities for smarter strategies.
Quantitative levels indicator
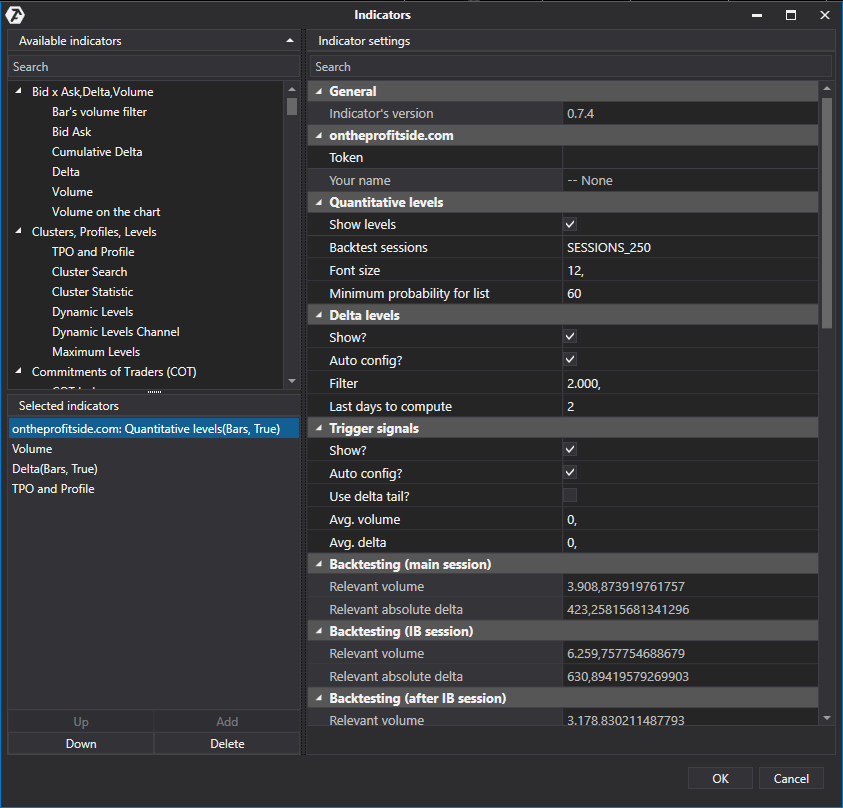
Details about the configuration options.
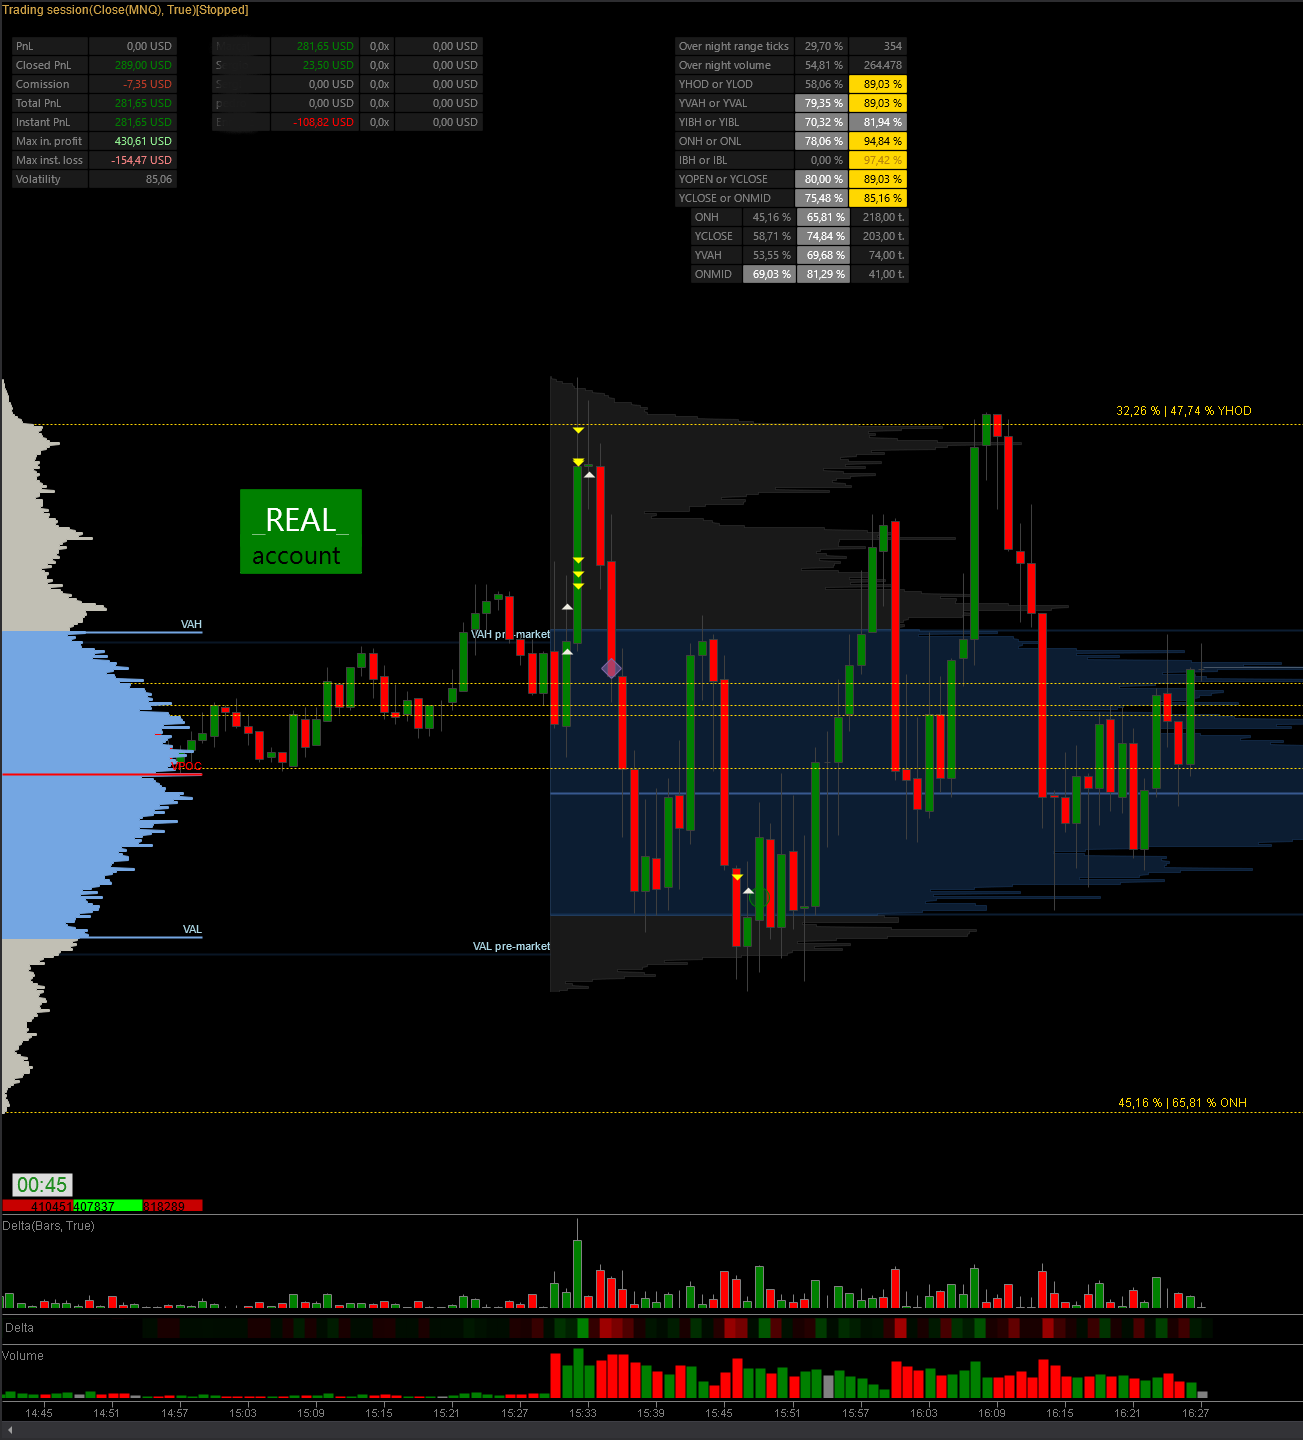
Showing the quantitative levels and their live probabilities to be touched.
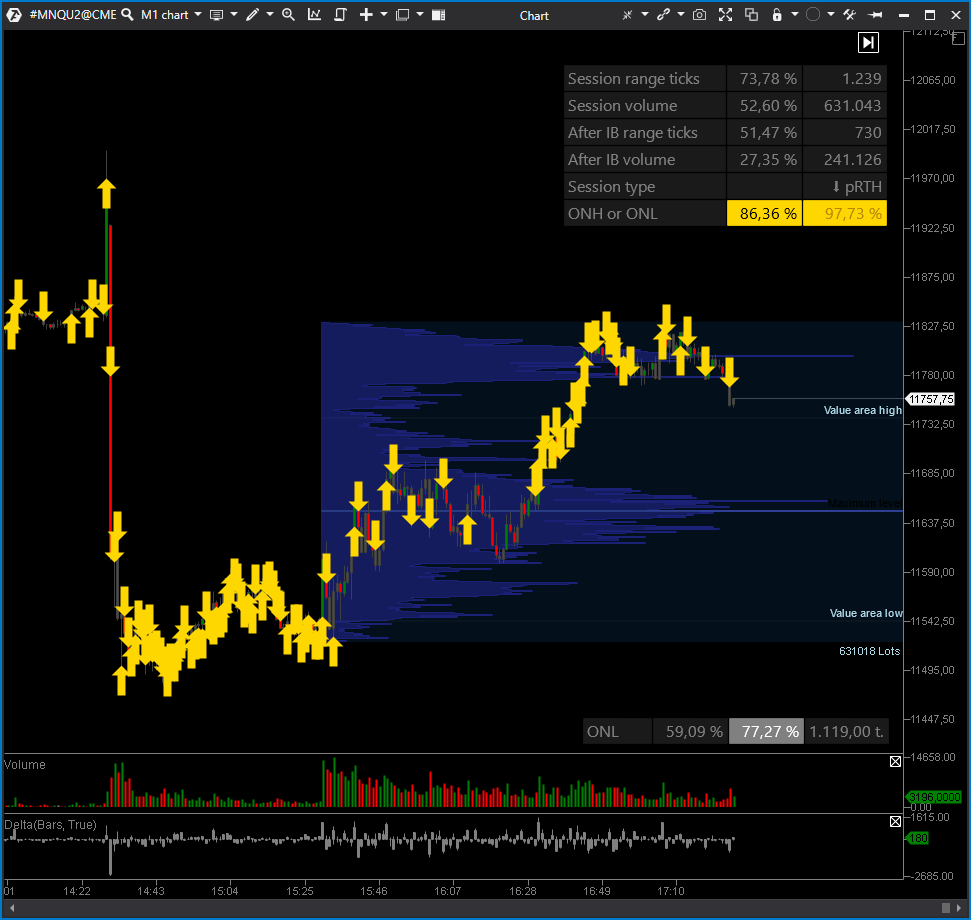
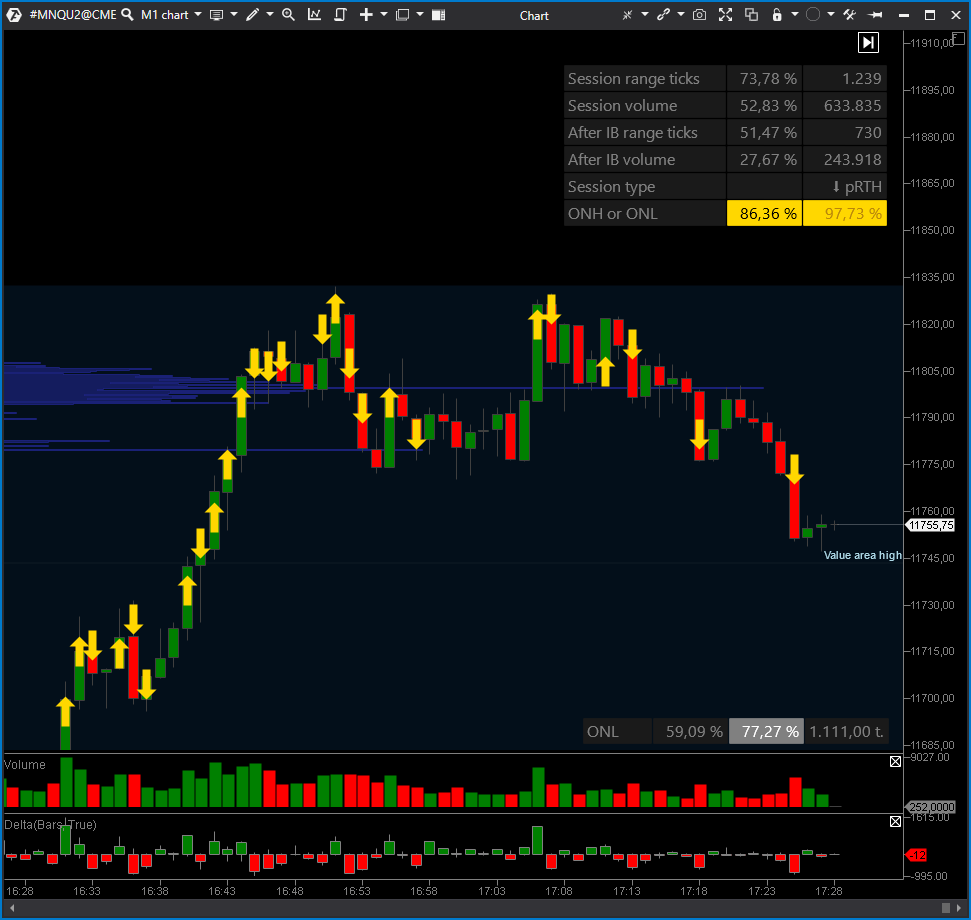
Delta levels.
Trigger signals.
Trigger signals (zoom).
With the Quantitative levels indicator you will be able to see levels used by institutional traders with their backtested probabilities to be touched in the current session. These probabilities are backtested whether the main session starts inside, above or below the last RTH (Regular Trading Hours) session.
The probabilities change dynamically if one level is touched during the session, so you'll see better insights as the session goes. If one level is touched, the paired level is updated with the probability to touch both levels at the same time (considerably reducing the probability to be touched).
We split the day session as Over Night session + Main Session. Over Night session starts after the closure of OTC (Over The Counter), and ends right before the Main Session starts. The Main Session is splitted into two parts, the Initial Balance and After Initial Balance. The Initial Balance is the first hour period of the Main Session. The remaining time is After Initial Balance, until the OTC closes.
You can change the visual representation of each level, like the color, width and line type.
This indicator and the backtesting service is included in the Advanced 🔮 plan, or sold individually.
Delta levels
Delta levels are shown in the POC (maximum volume value) of a candle where it's delta value exceeds certain threshold. This threshold can be defined manually or automatically. When set automatically it will use a projected value from the backtesting (for positive and negative values independently), and is different for Over Night, Initial Balance and After Initial Balance sessions.
You can use this levels as an extra confirmation with other levels, or to expect some resistance when the price approaches it.
Trigger signals
Trigger signals are shown in the POC (maximum volume value) of a candle where it's volume, delta, and optionally delta tail values exceeds certain thresholds. This thresholds can be defined manually or automatically. When set automatically it will use a projected value from the backtesting, and is different for Over Night, Initial Balance and After Initial Balance sessions.
You can use this levels as an extra confirmation with other levels, or to expect a reversal with other confirmations.
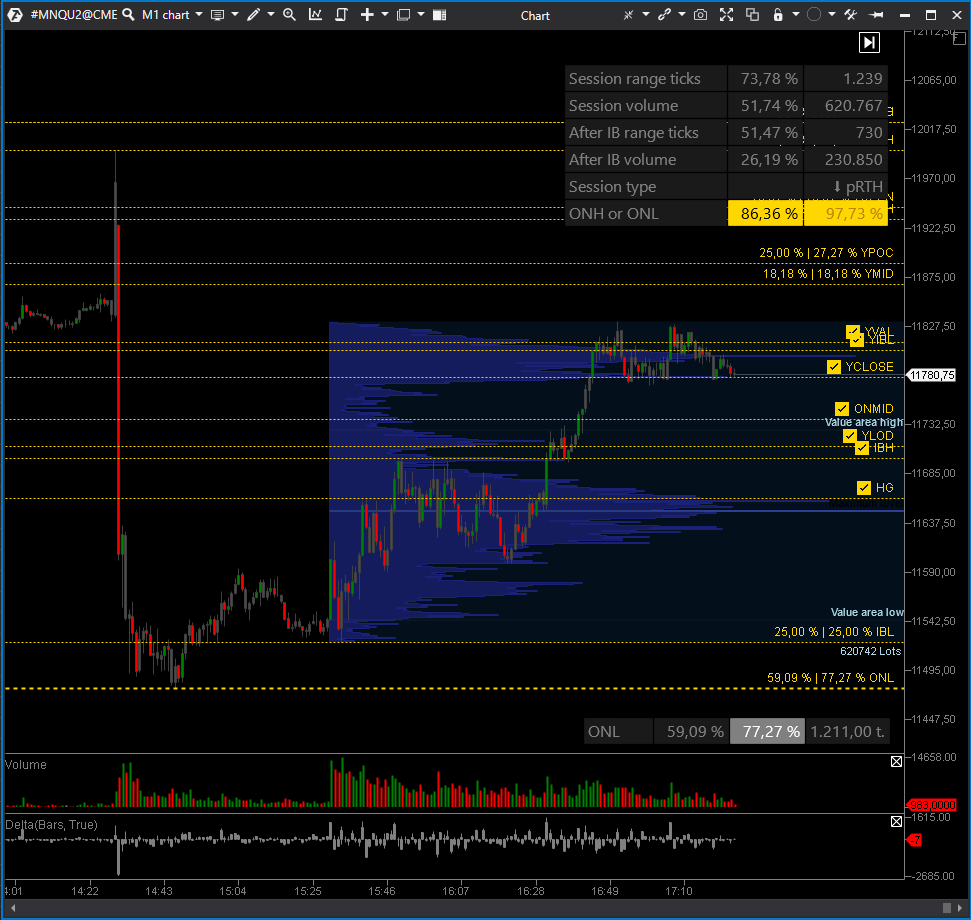
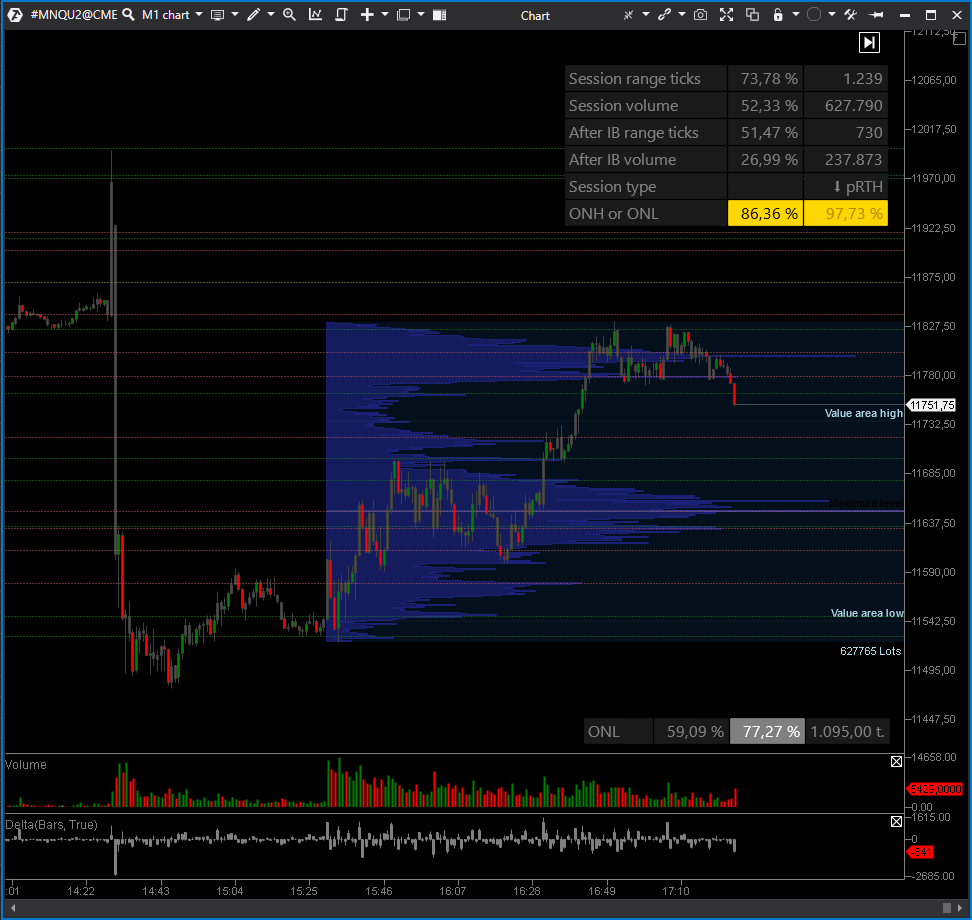
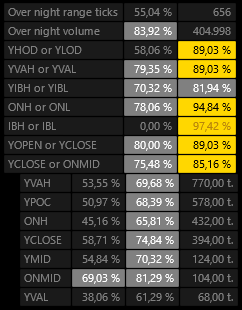
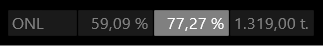
Levels tracked
| Level | Description |
|---|---|
| YHOD | Yesterday High of Day (of yesterday's Main Session). |
| YLOD | Yesterday Low of Day (of yesterday's Main Session). |
| YMID | Yesterday Mid of Day (of yesterday's Main Session). |
| YVAH | Yesterday Value Area High (of yesterday's Main Session). |
| YPOC | Yesterday volume POC (of yesterday's Main Session). |
| YVAL | Yesterday Value Area Low (of yesterday's Main Session). |
| YIBH | Yesterday Initial Balance High (first hour of yesterday's Main Session). |
| YIBL | Yesterday Initial Balance Low (first hour of yesterday's Main Session). |
| YOPEN | Yesterday Open (of yesterday's Main Session). |
| YCLOSE | Yesterday Close (of yesterday's Main Session, when OTC closes). |
| HG | Half Gap. Half price distance between YCLOSE and when the new Main Session opens, if the new Main Session opens outside last Main Session (RTH) range. |
| ONMID | Over Night Mid (half price distance of last Over Night session). |
| ONH | Over Night High. |
| ONL | Over Night Low. |
| IBH | Initial Balance High (first hour of current Main Session). |
| IBL | Initial Balance Low (first hour of current Main Session). |
Backtesting
The backtesting is executed for the last 2 years, 1 year, 6 months and 3 months sessions for each instrument that we support (currently ES, MES, NQ, MNQ, CL, MCL and QM). The backtesting is updated automatically in a regular basis.
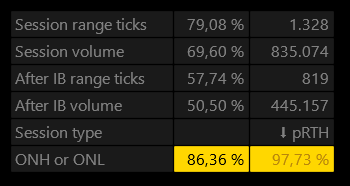
In the top right section of your chart will be displayed some valuable information, like overall projected Main Session range ticks and volume, projected sub Main Session range ticks and volume and OR probabilities (probability to touch a pair of quantitative levels. One or the other).
Below these values, it will appear the upper current price levels that have relevant probability to be touched, and the distance in ticks from the current price. For the above current price levels will appear at the bottom right of the screen. For each level we show the probability to touched in the current part of the Main Session, and the overall probability to be touch in the whole Main Session.
Trading sessions
| Instrument | Start | Initial Balance | End | Overnight |
|---|---|---|---|---|
| Nasdaq (NQ, MNQ) | 8:30 AM CST | 1 hour (9:30 AM CST) | 3:00 PM CST | 5:00 PM CST |
| S&P 500 (ES, MES) | 8:30 AM CST | 1 hour (9:30 AM CST) | 3:00 PM CST | 5:00 PM CST |
| Russell 2000 (RTY, M2K) | 8:30 AM CST | 1 hour (9:30 AM CST) | 3:00 PM CST | 5:00 PM CST |
| Dow Jones (YM, MYM) | 8:30 AM CST | 1 hour (9:30 AM CST) | 3:00 PM CST | 5:00 PM CST |
| Crude oil (CL, MCL, MQ) | 8:00 AM CST | 1 hour (9:00 AM CST) | 2:30 PM CST | 5:00 PM CST |
| Gold (GC, MGC, YG) | 7:30 AM CST | 1 hour (8:30 AM CST) | 3:15 PM CST | 5:00 PM CST |